I surveyed customers to redesign Rivian Financial Services's offering page – increasing revenue by $5.28 million a year

My role
Survey writing and creation
UX strategy and design
UI design
Copywriting
Prototyping
Presentation
Usability testing
Data analysis
Team
Lead UX Researcher
Copywriter
Manager, Digital Analytics
Engineering, Digital Analytics
Illustrator
Stakeholders
Director, UX Digital Design
Senior Product Manager
Director, Rivian Financial
Sr. Director, Rivian Financial
Background
With Rivian vehicles being unprofitable at the time of this project, tapping into profitable areas of the business was critical. I had an ambitious goal to redesign the financing page to increase revenue for the business and clarity for customers.
Goals
Learn why customers do or do not choose Rivian to finance their vehicle
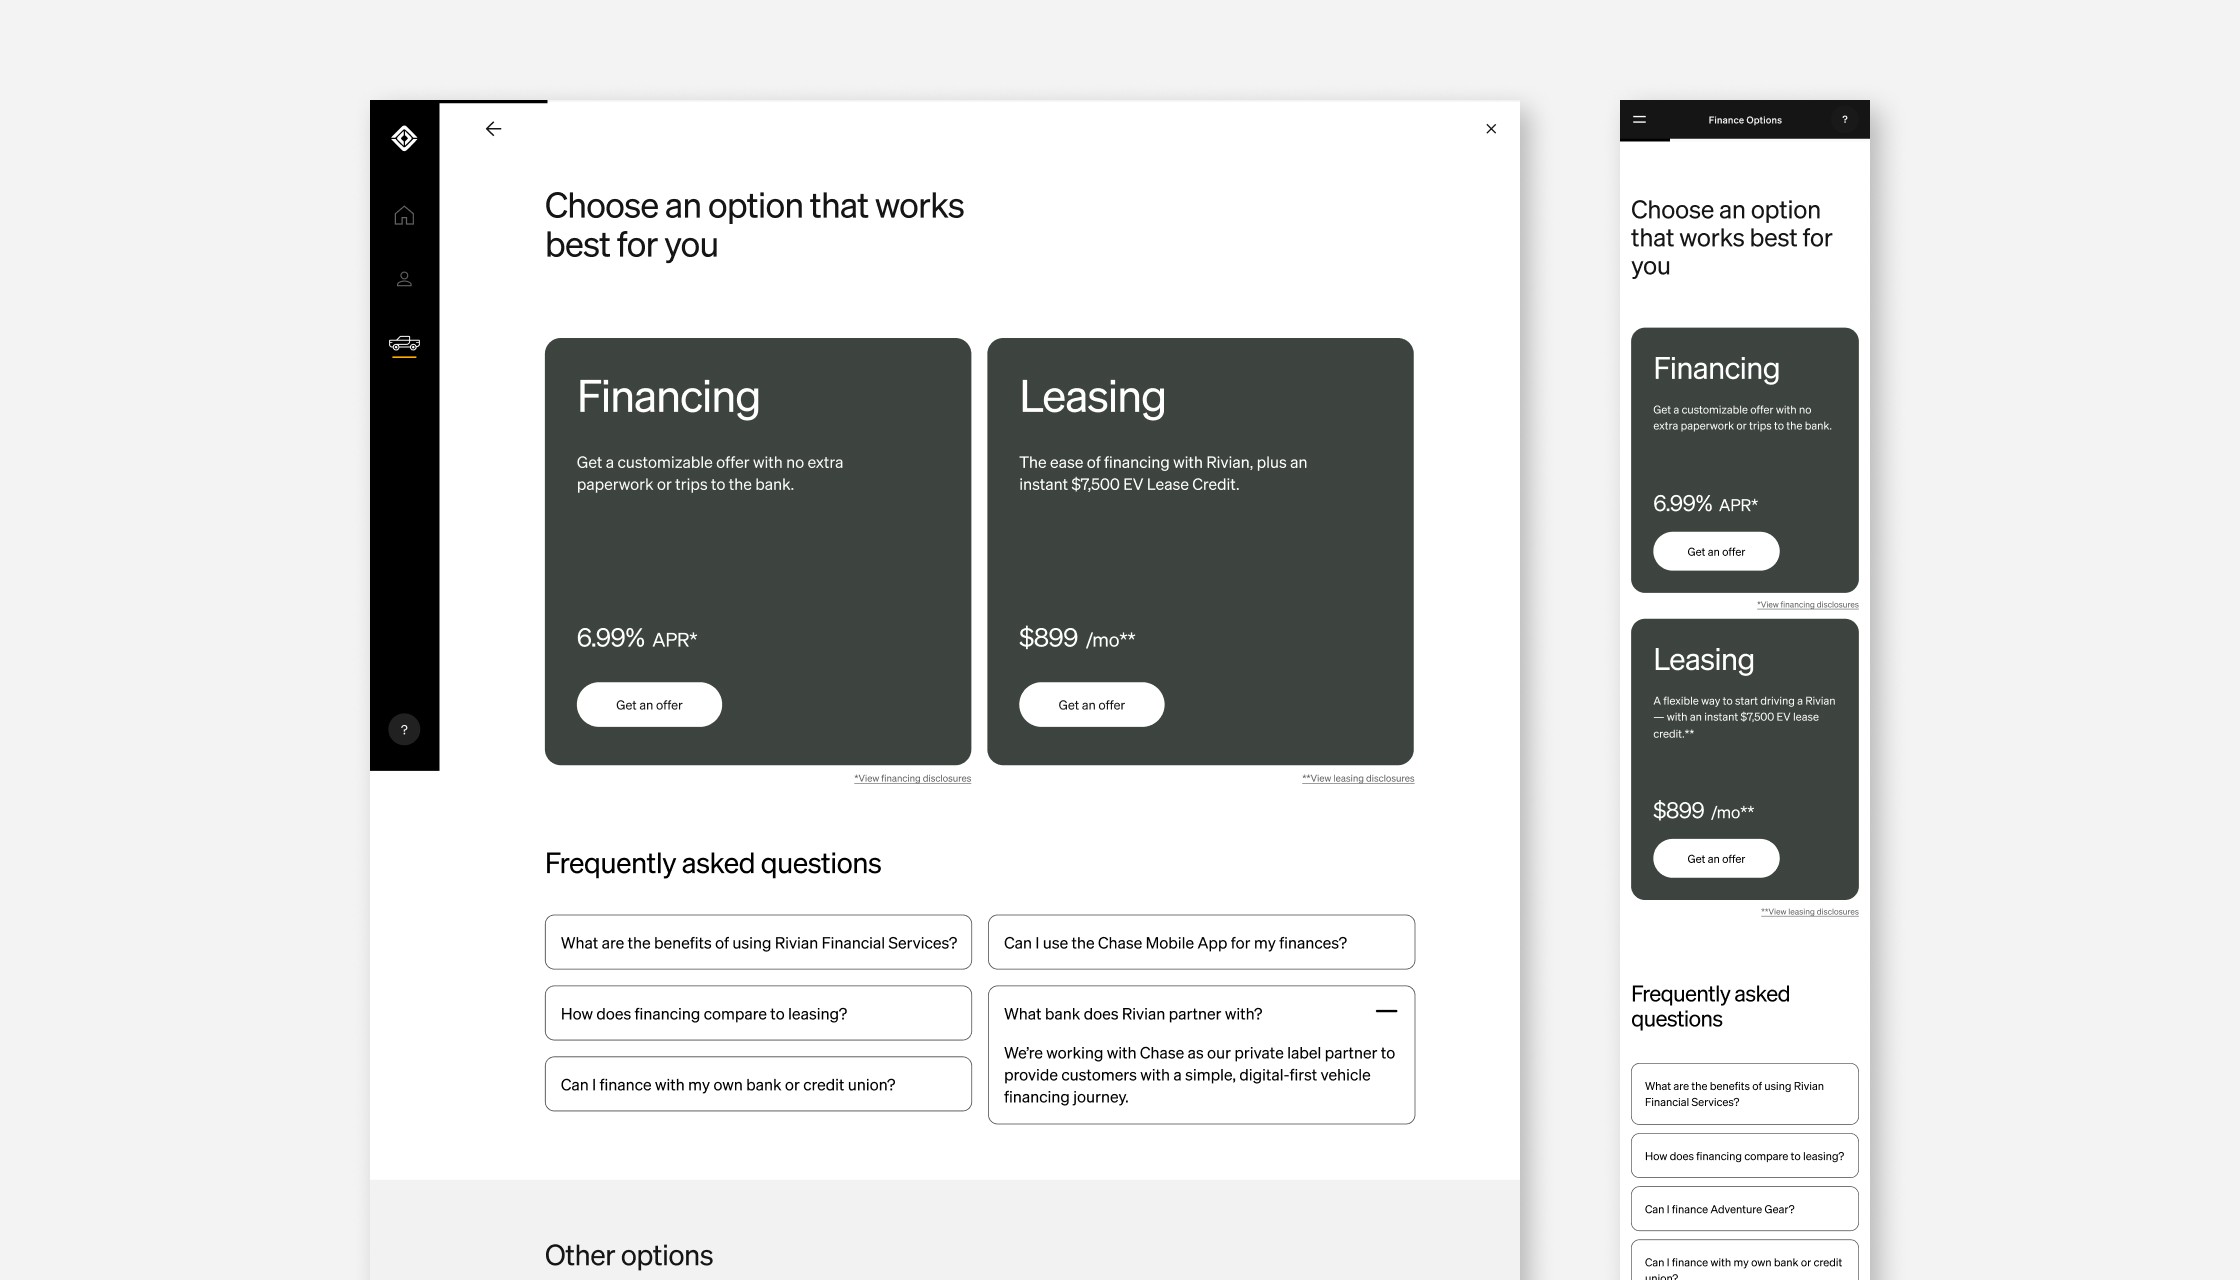
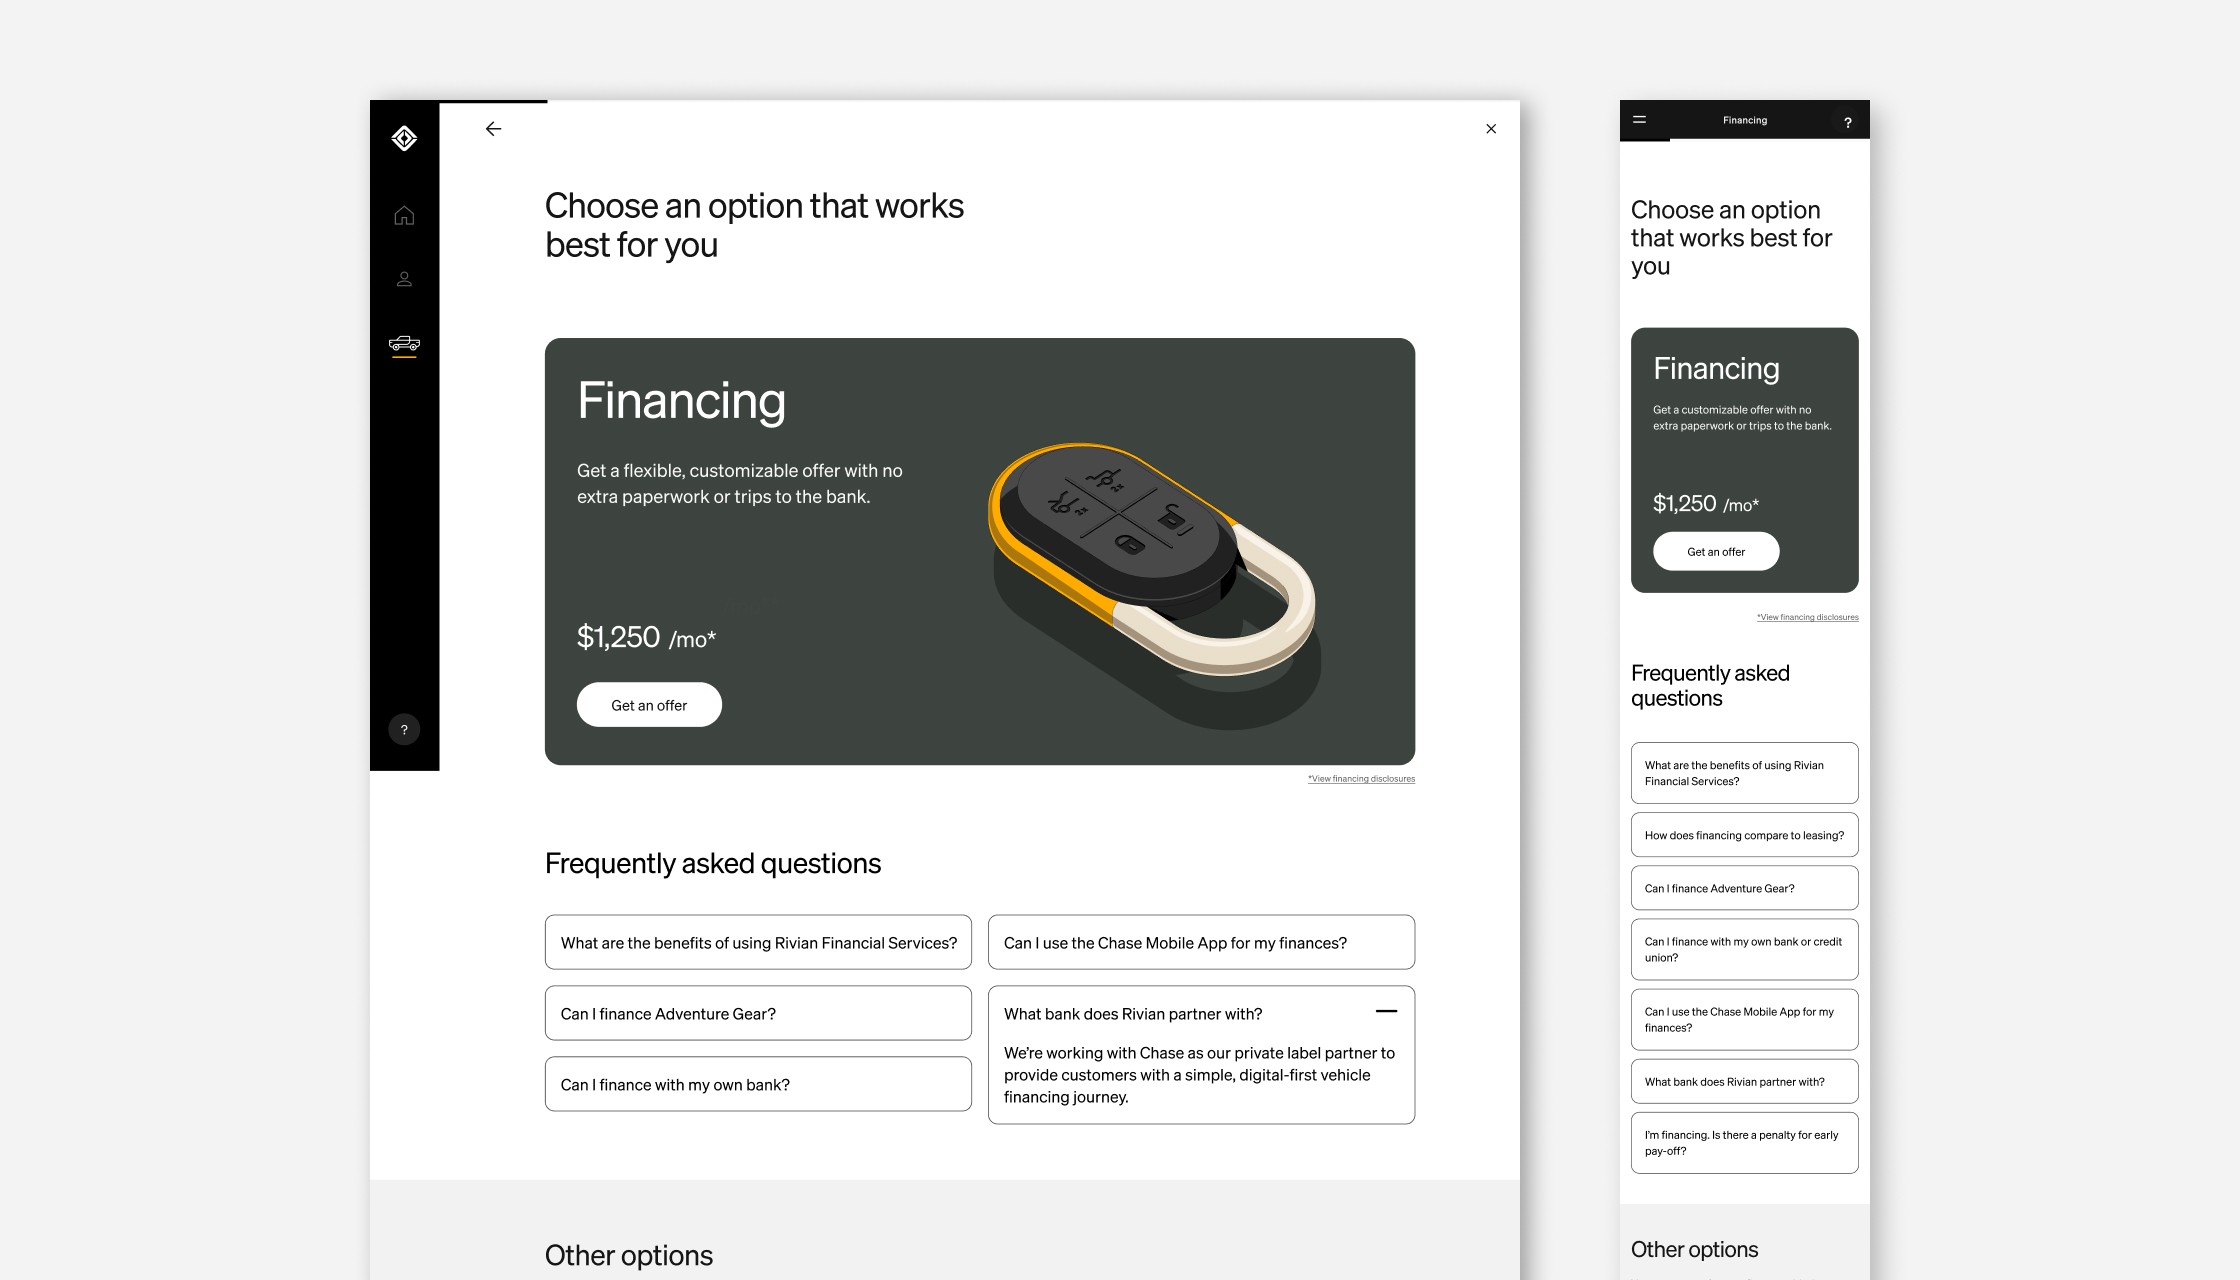
Redesign the financing offerings page
Increase revenue
Discovery and definition
Data collection and survey writing
Before designing, it was imperative to collect data from real customers. My goal was to understand why or why not customers chose Rivian Financial Services and gather insight on what copy and design could influence to improve rates.
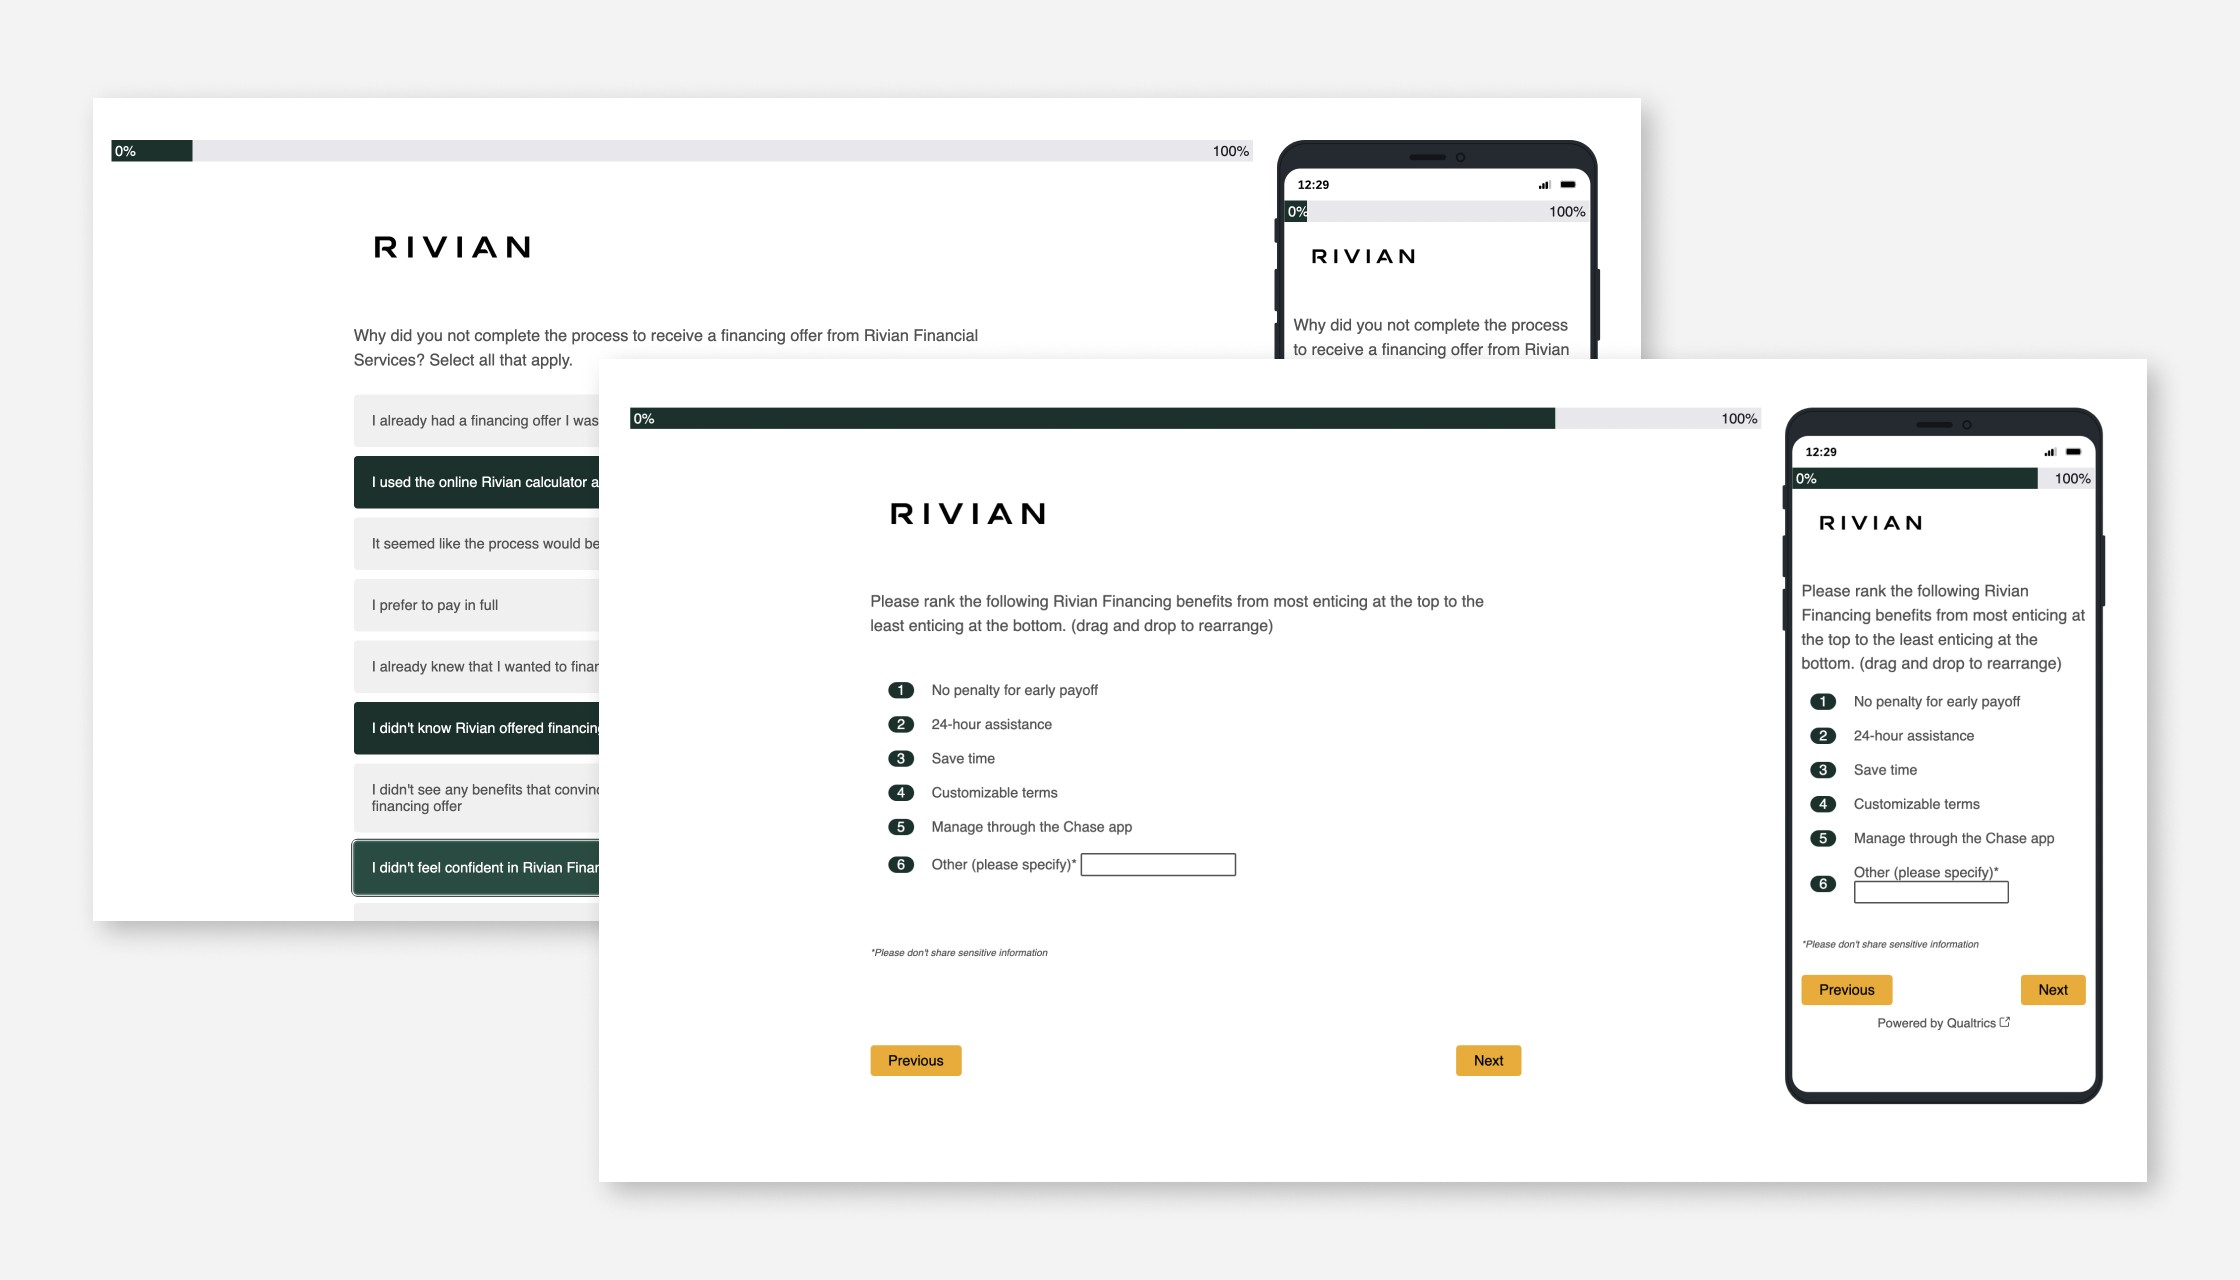
I started by conducting stakeholder interviews to gather data and assumptions from our in-house experts. That information helped me write a multi-step survey. I created the survey and consulted with our UX Researcher and Copywriter for feedback on research and brand and tone tips.
We launched the survey with customers who went through our finance process in the last 2 weeks and got 196 responses in a few days.
Audit existing experience
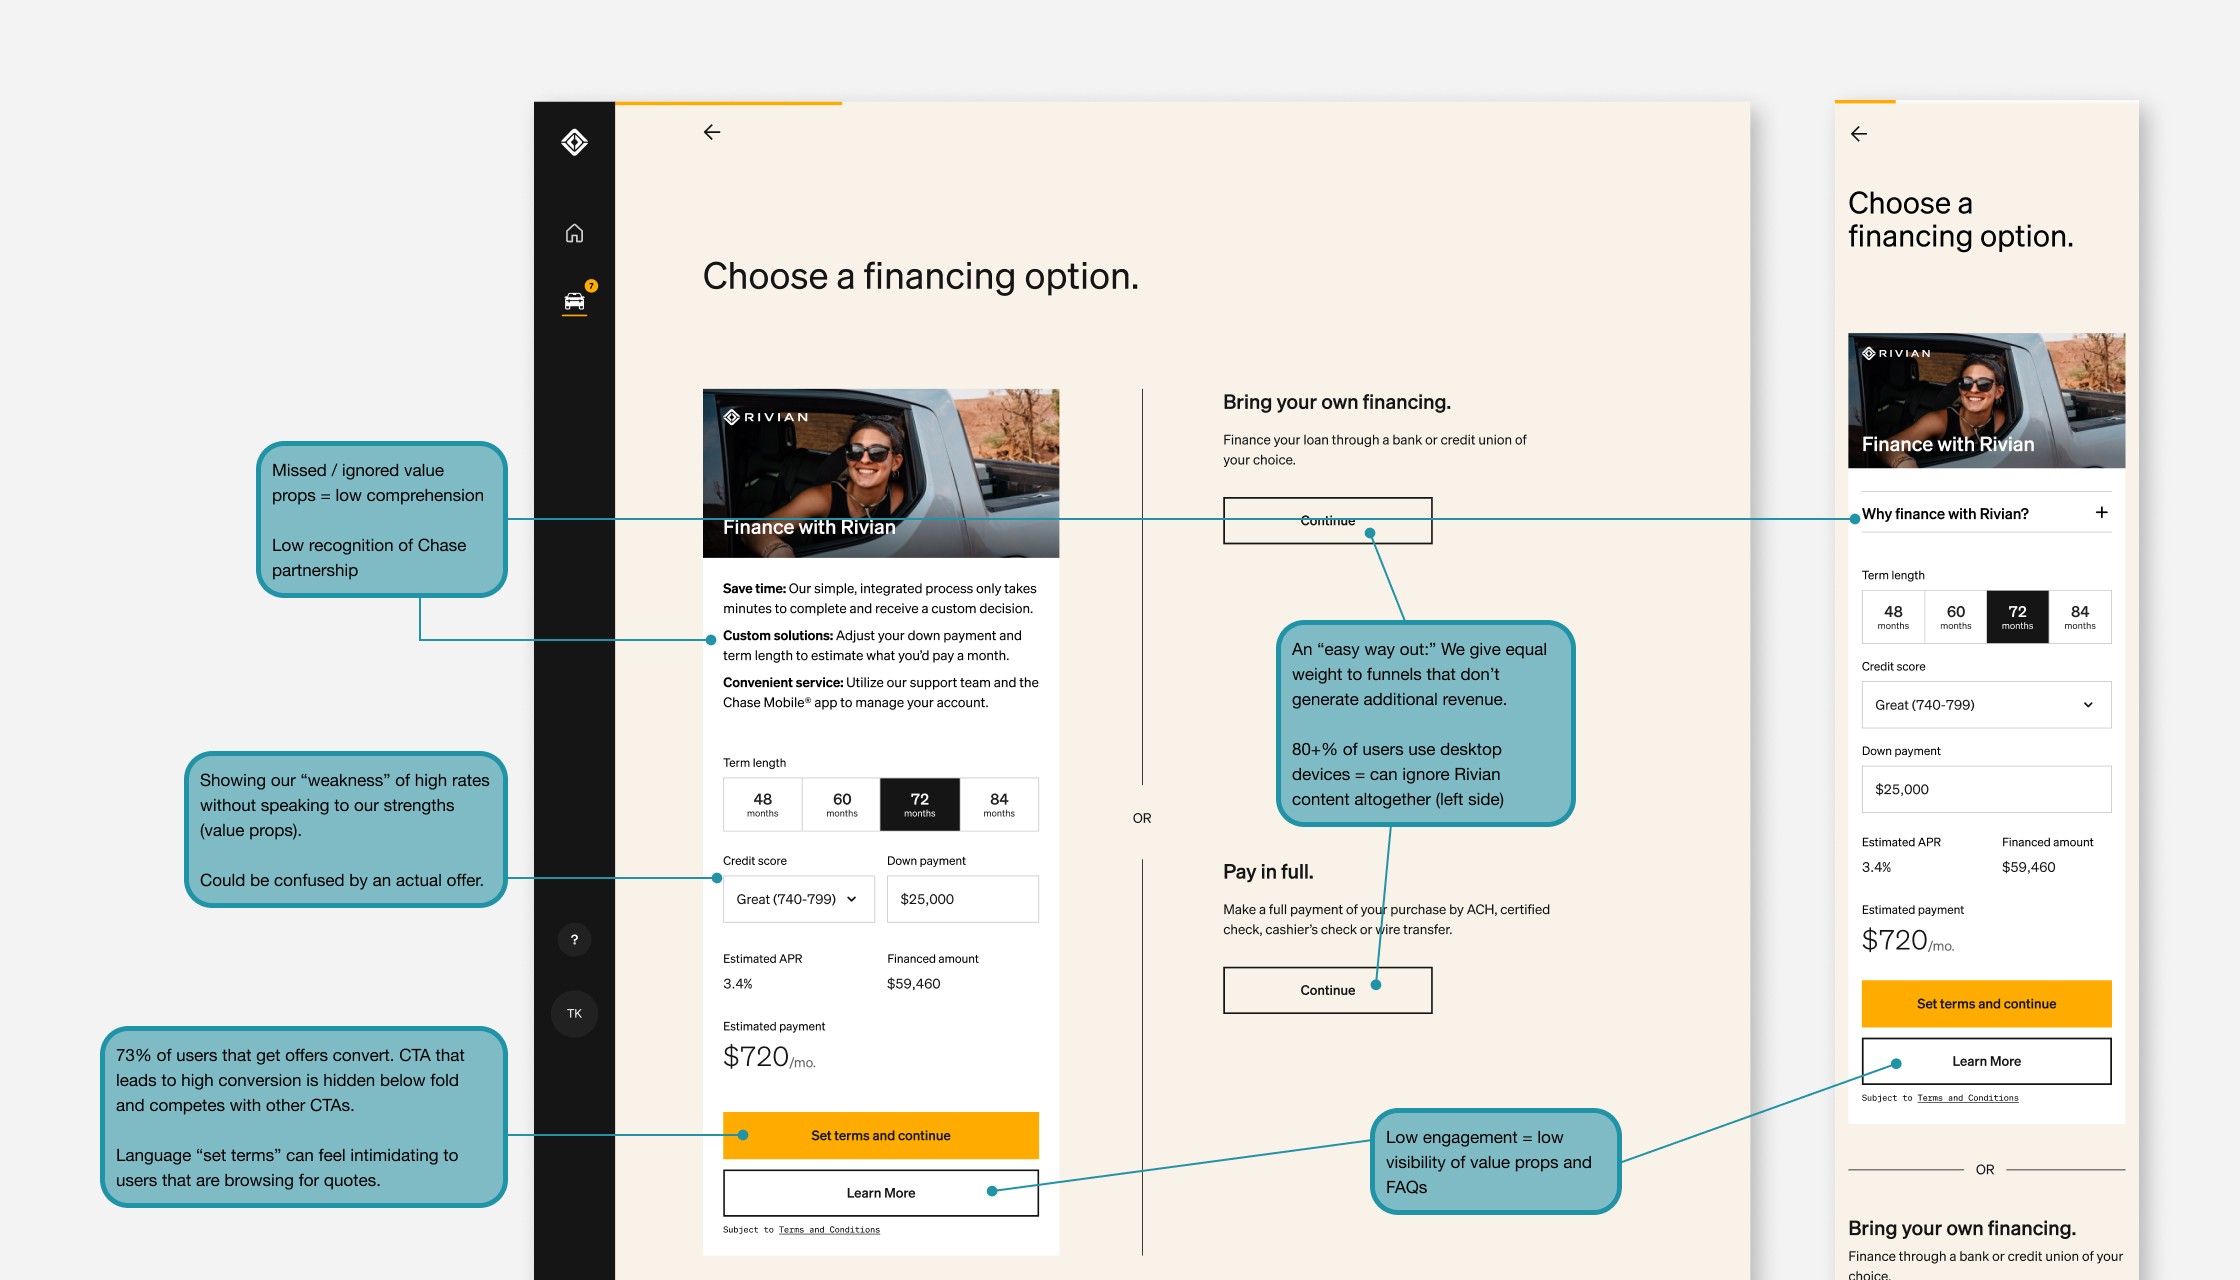
As I awaited survey responses, I completed an audit of our existing experience. I outlined assumptions of problematic areas based on the data and anecdotal notes I heard from our stakeholders and customers. This was the start to figuring out what design and copy could help influence to improve margins.
Analyze survey results
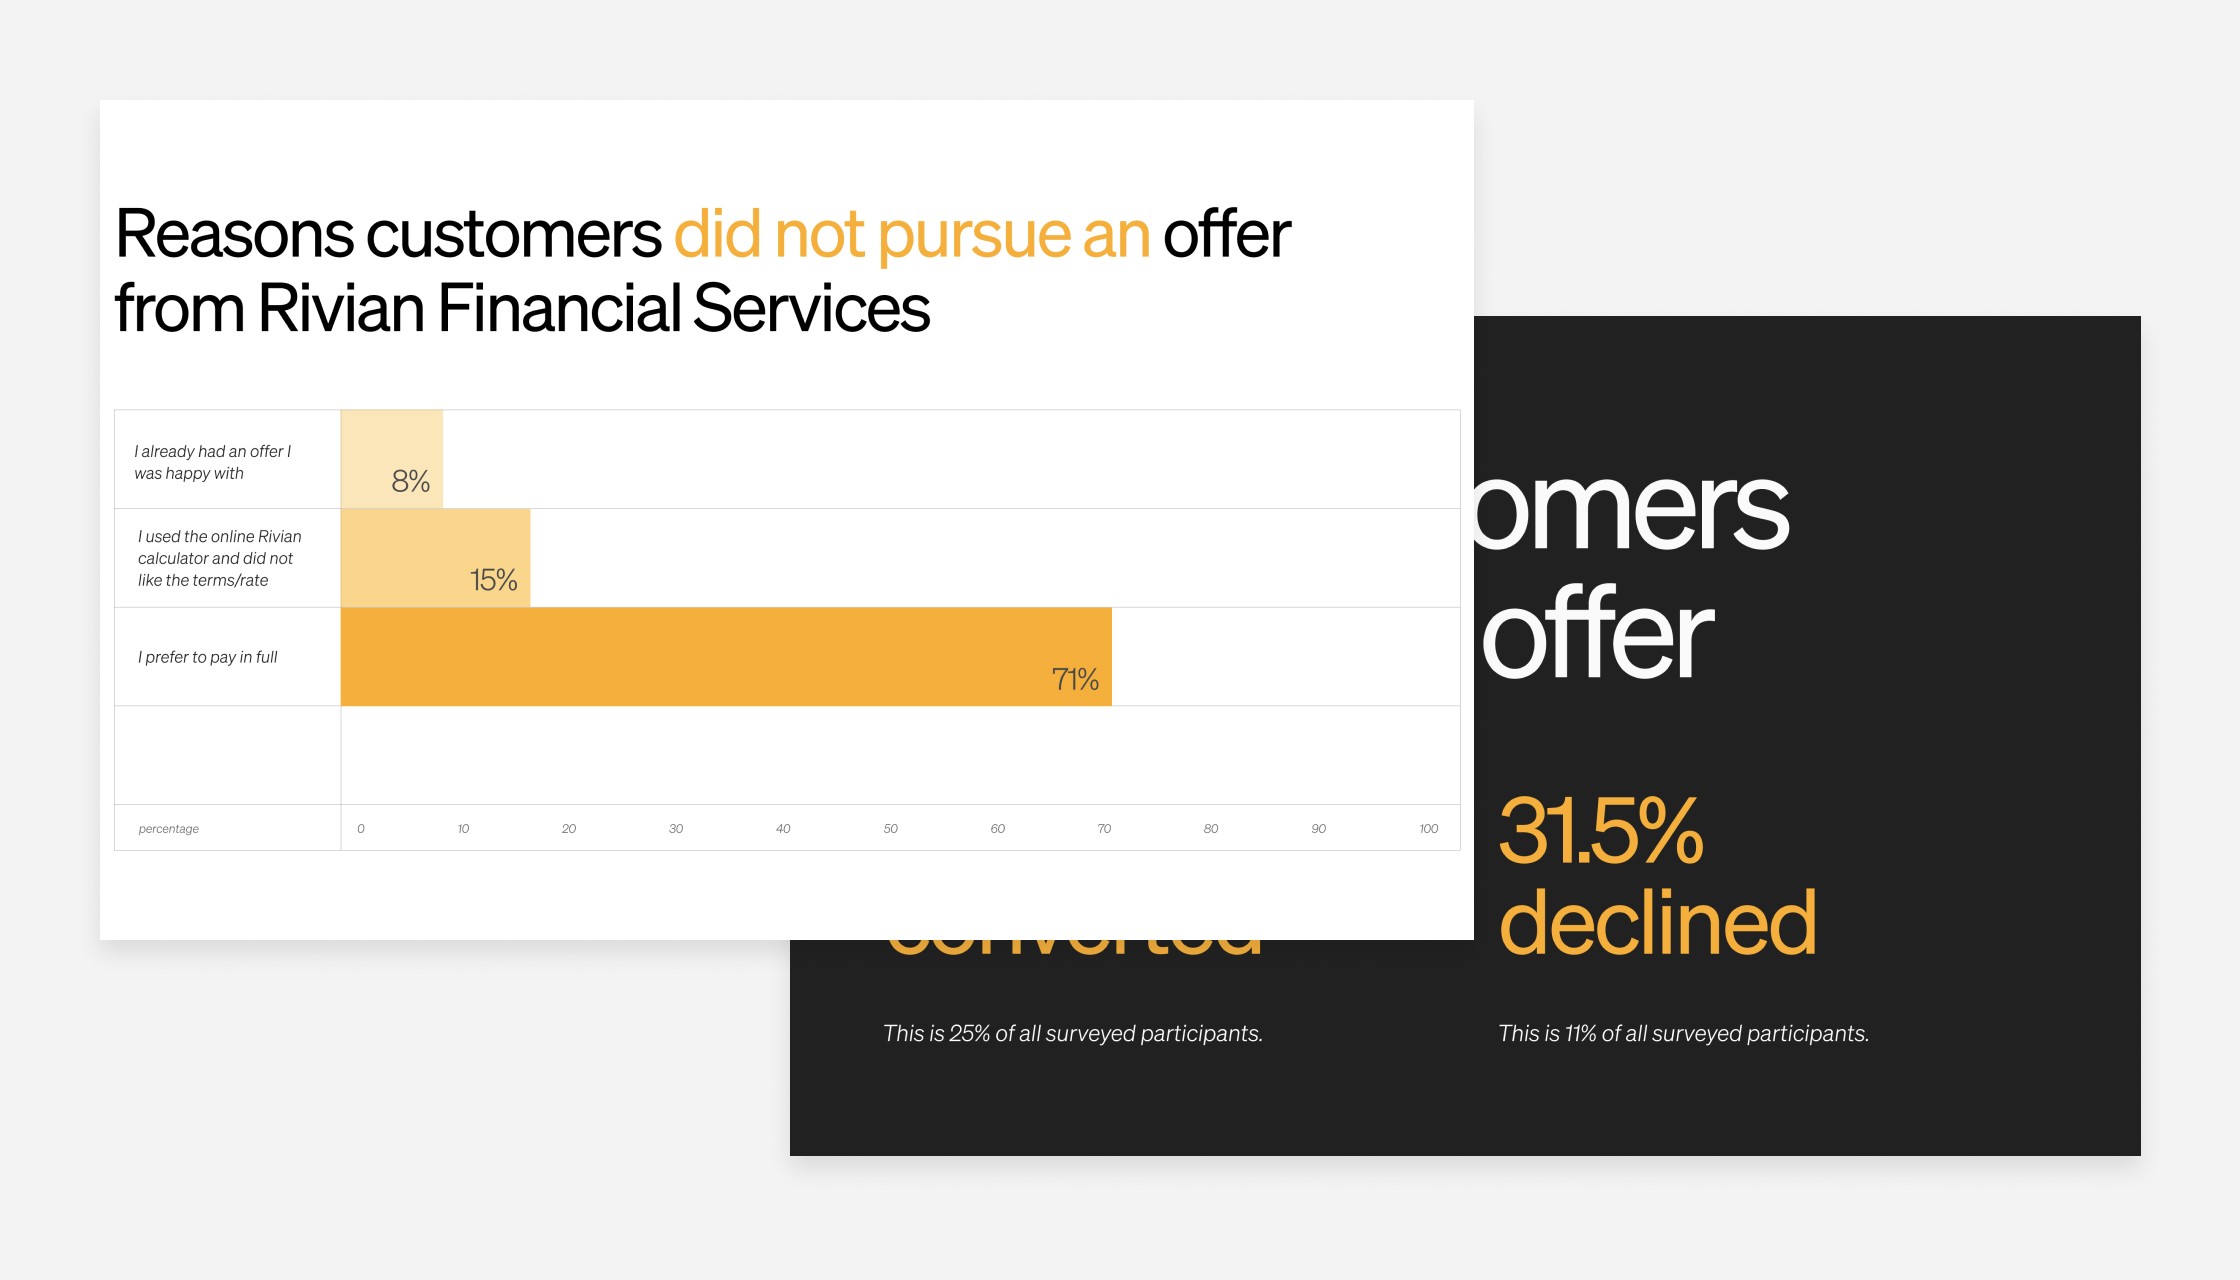
After the survey had sufficient responses, I analyzed the data using Qualtrics. We learned several things: Customers largely prefered to pay for their vehicles in full. But, of the customers that financed, they chose Rivian Financial Services mainly because of convinience. Additionally, customers were not comprehending our value props as expected and customers who did start a finance application with Rivian were extremely likely to convert – this presented unique opportunities for a redesign.
I consolidated the data and key takeaways in a presentation to share with stakeholders. This data was valuable for various teams across Rivian and shared with the team at Chase, including the president of auto loans.
Ideation and design
Data-driven design
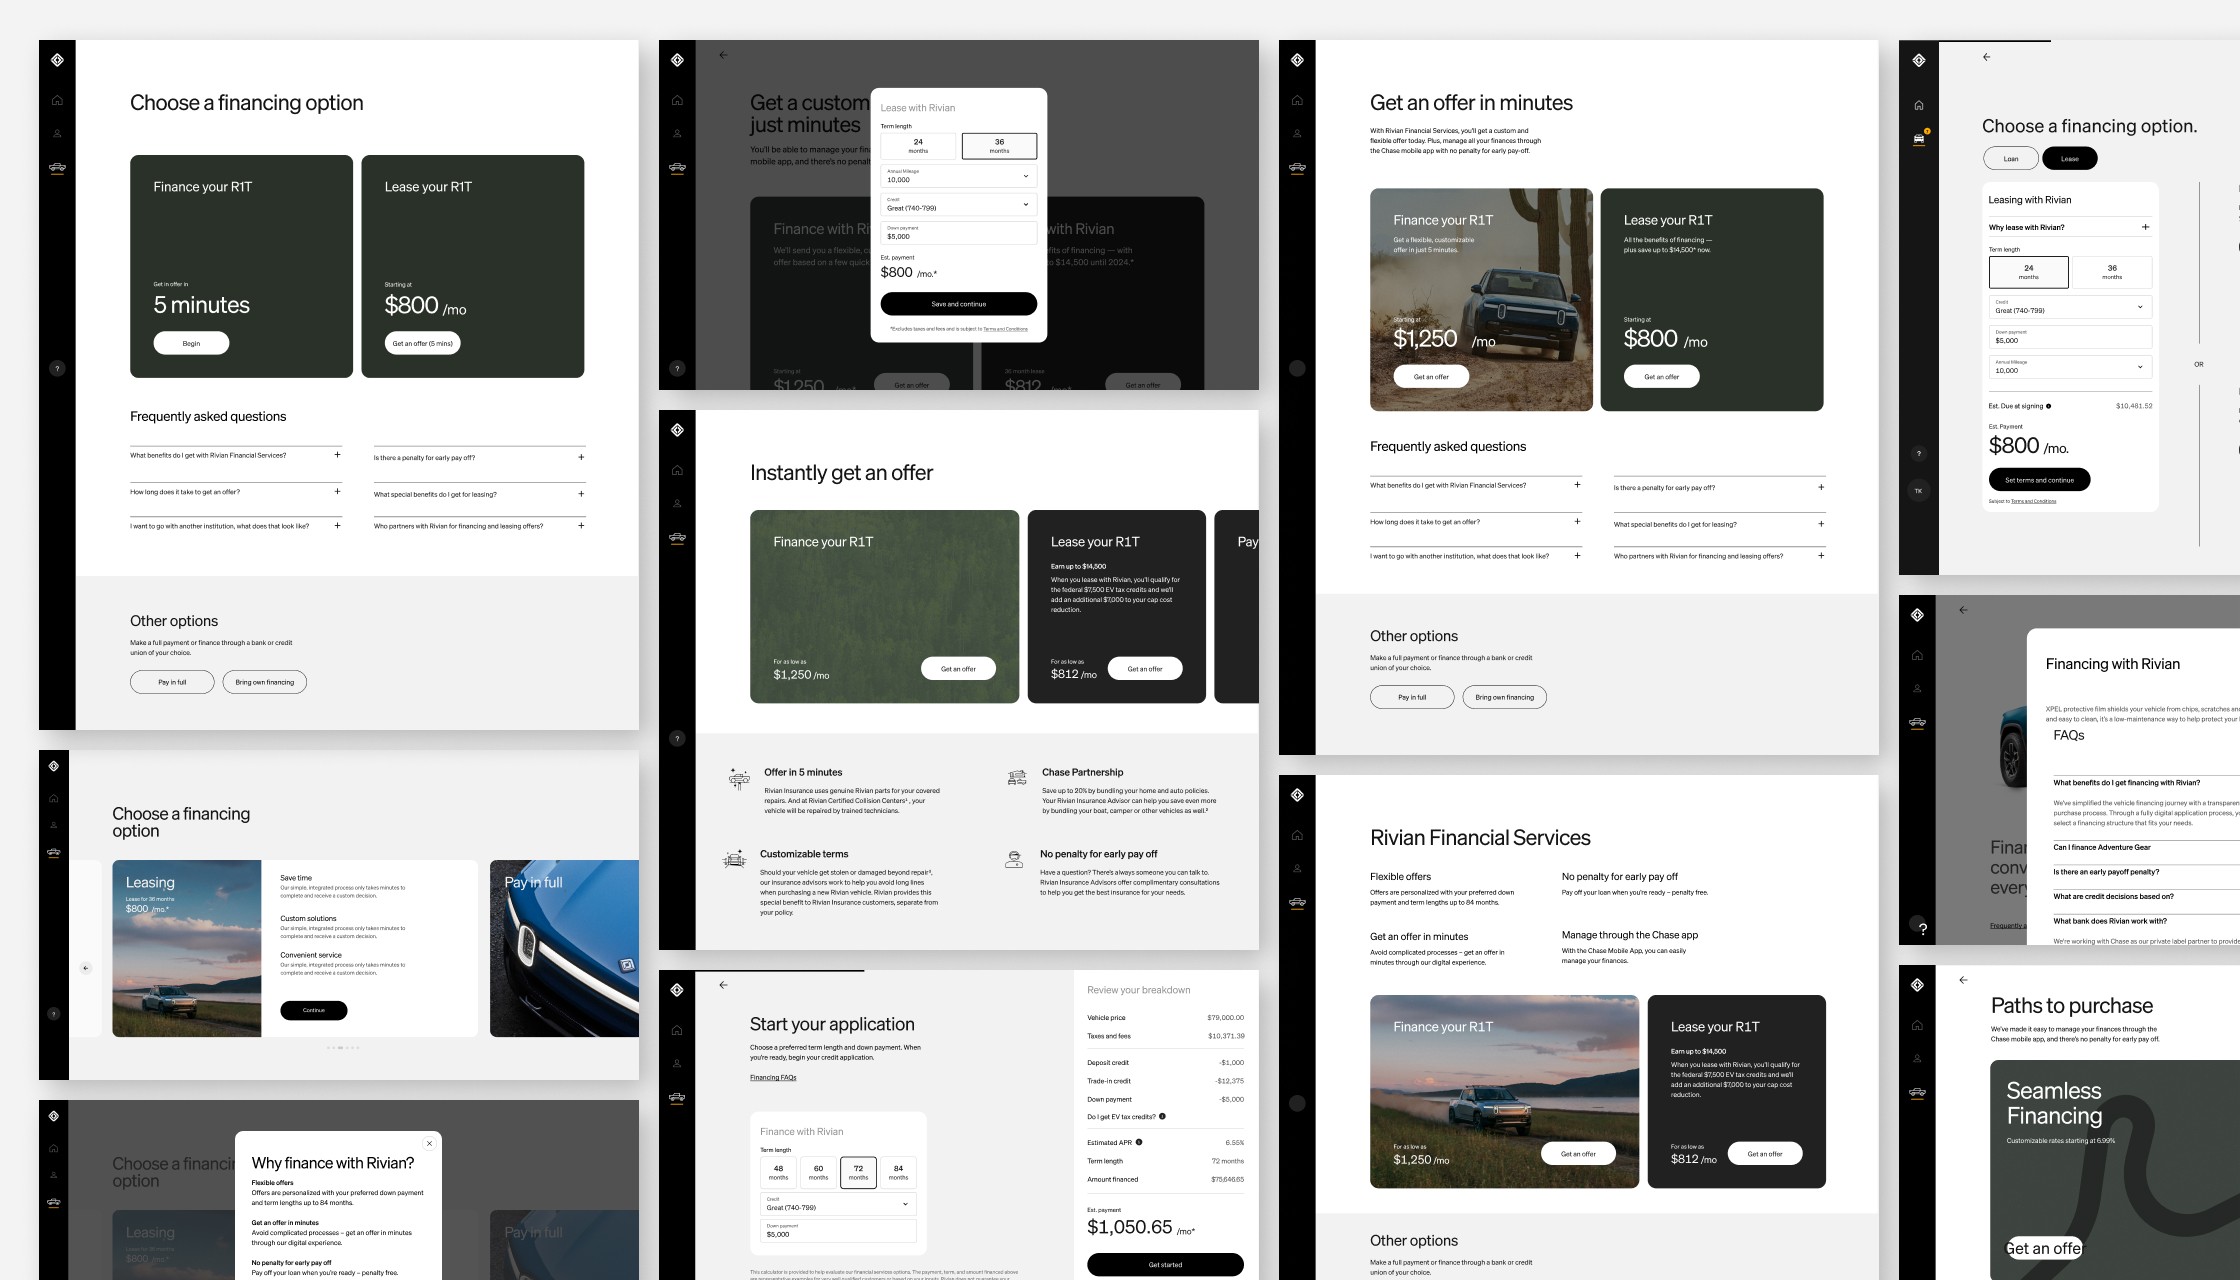
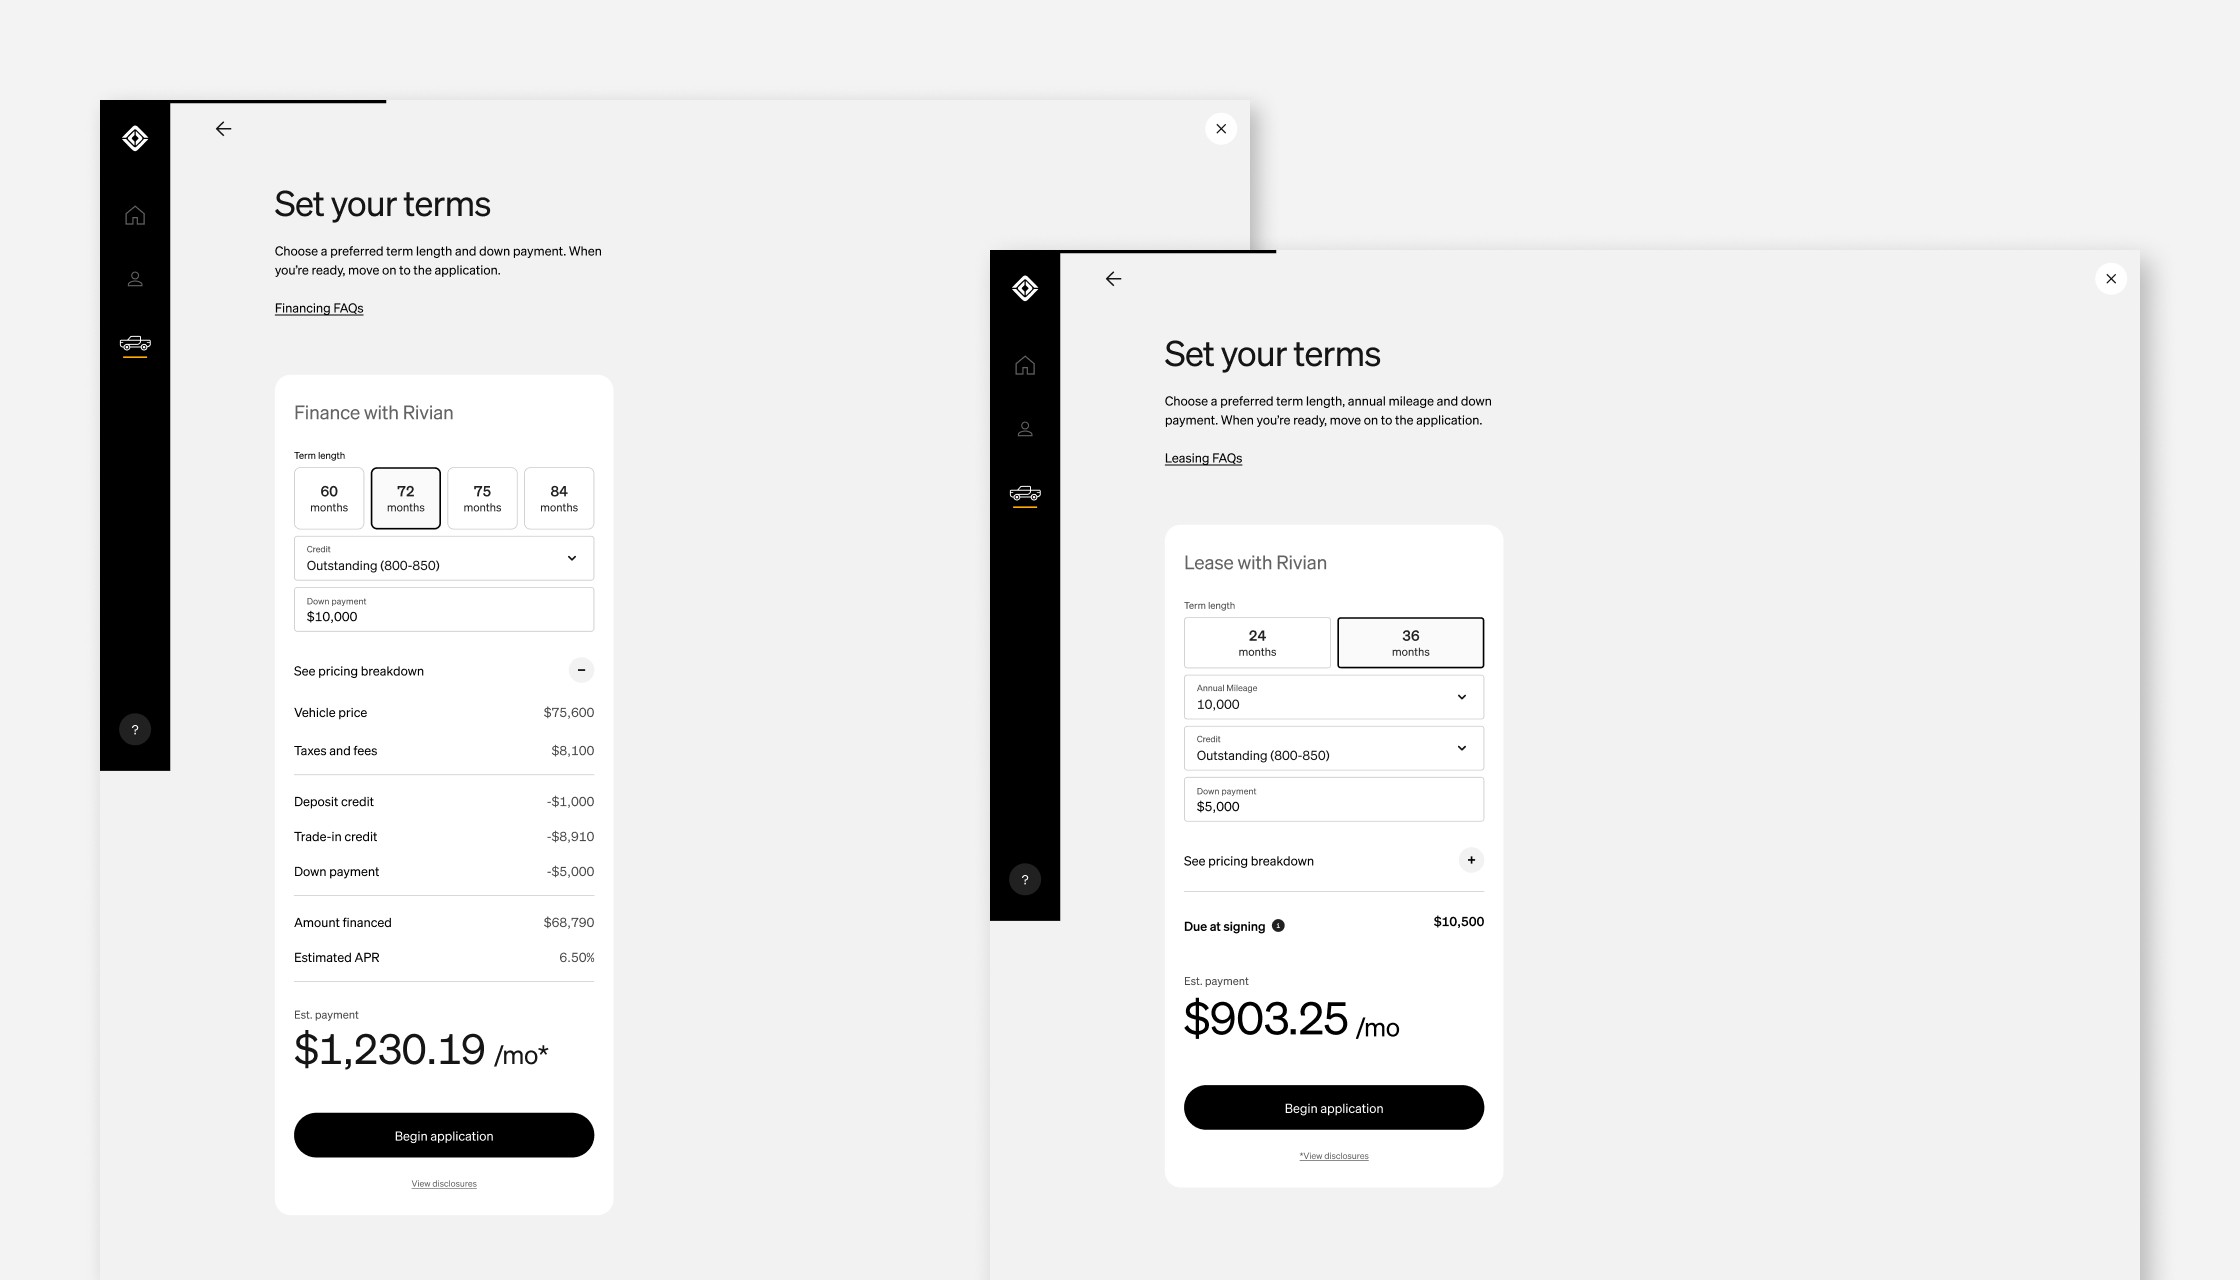
Backed with valuable data about what moves customers to convert, I was able to produce several possible concepts. It was paramount to use existing components within our design system to ensure a speedy launch. This included redesigning the offer pages, the loan calculators and testing various copy for efficiency.
Analyze design impact
Launch and monitor
The new designs were launched in our experience to real customers. I worked with our digital analytics team to ensure heat maps were activated in the new pages as to monitor usability.
Our designs were successful! "Get an offer" buttons were the most clicked on area on the page. Additionally, users that wanted to pay in full or use another instution were not lost; this told us we did not create a dark ux pattern.
Conversion increased 10-11% almost immediately – this translates to an increase of $440k a month.